
Appearance
Marker Map
Overview
Before using the map, you must obtain an API Key and configure the map settings. For details, refer to GIS Map Settings.
The Marker Map is used to plot data points on Mapbox or AMap (Gaode Map). Users can set a uniform marker shape in the style settings, such as circle, triangle, square, square column. All points will use the same marker shape., and distinguish different categories using color or size.
When to Use
- Visualizing geographic data by displaying location information with markers.
- Analyzing spatial distribution patterns, such as store sales across different cities, population density, or business coverage.
- Comparing different data categories using distinct marker shapes or colors.
Data Structure
The Marker Map requires the following data (Longitude & Latitude or Location is required):
- Longitude & Latitude / Location: Longitude and latitude are numerical values representing the position of data points. Location can be a geographical name (e.g., city, address).
- Category (Optional): Used to differentiate data points, displayed using color encoding.
- Marker Size (Optional): A numerical field to define marker size (e.g.,
store_sales). - Tooltips (Optional): Displays additional details when hovering over a marker.
- Filters (Optional): Used to filter displayed data (e.g., by country or sales range).
Location Parsing
If the dataset contains a Location field but does not include longitude and latitude, the system will use Mapbox or AMap's geolocation API to query the corresponding coordinates and cache them in the OptimiBI system. When loading the map later, the system retrieves the longitude and latitude from the cache to improve loading speed.
If the dataset already contains Longitude & Latitude, the map will directly use them for rendering markers without requiring location parsing.
Configuration Guide
Plot Data Points Using Longitude & Latitude or Location
Example Data Structure
| Location | Longitude | Latitude | store_sales |
|---|---|---|---|
| New York | -74.006 | 40.7128 | 100000 |
| Los Angeles | -118.2437 | 34.0522 | 85000 |
| Chicago | -87.6298 | 41.8781 | 72000 |
| Houston | -95.3698 | 29.7604 | 69000 |
| Miami | -80.1918 | 25.7617 | 50000 |
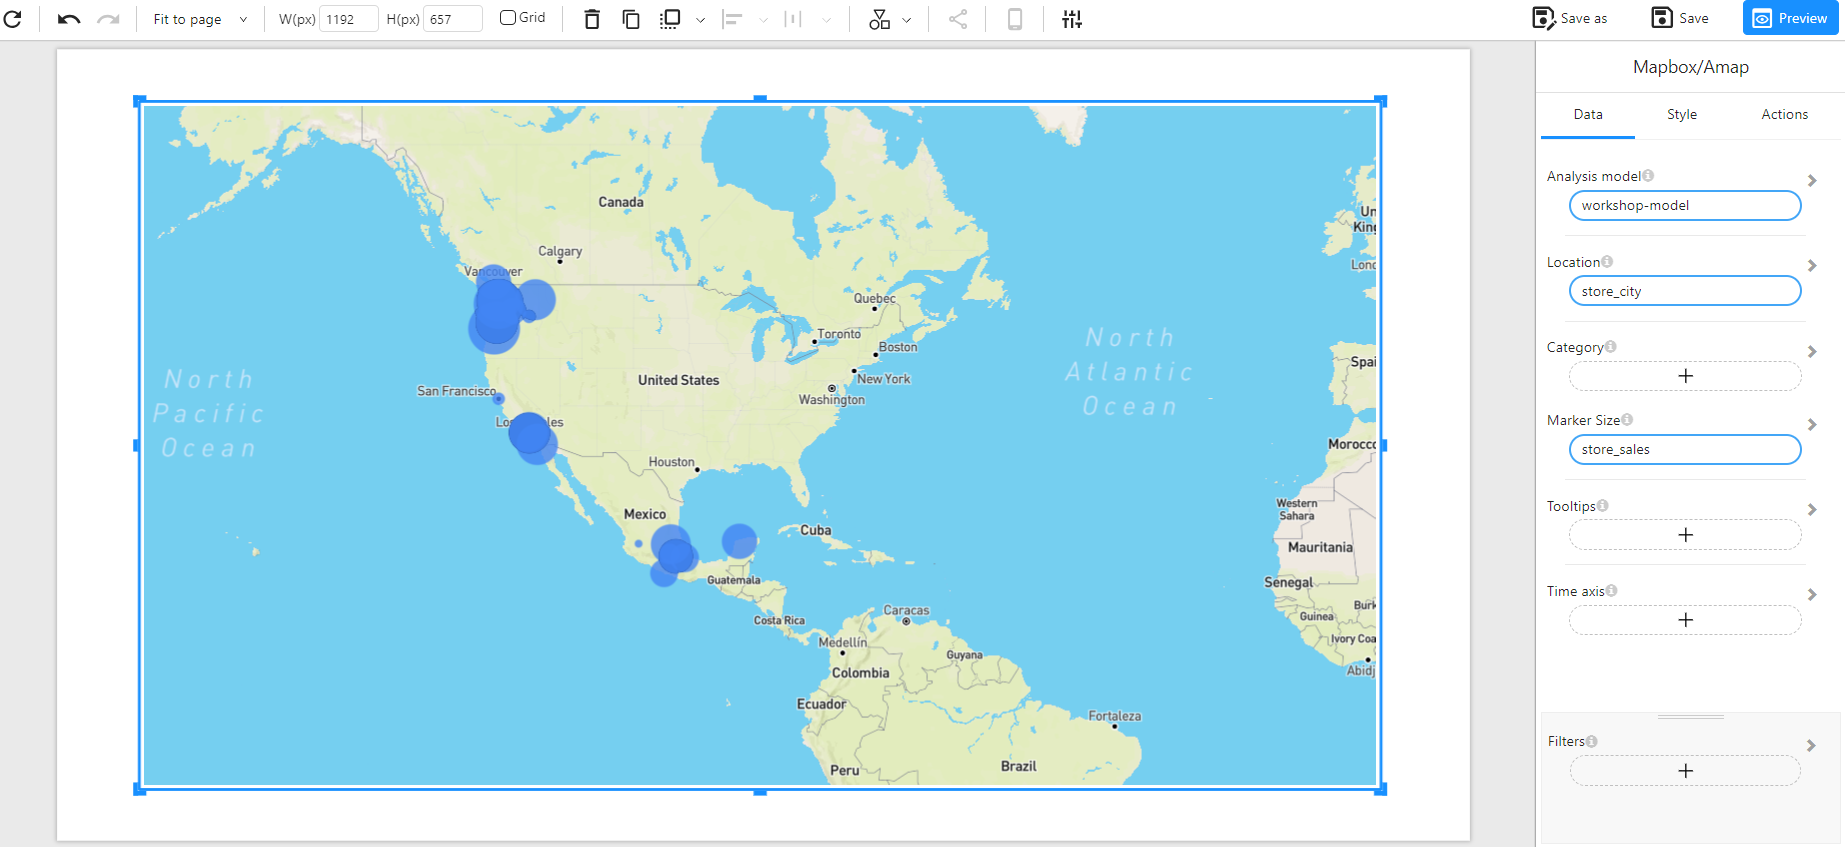
Example: The following example visualizes store sales using different marker shapes, with size based on sales values.
Customization Options
- Map Providers: Supports Mapbox and AMap (Gaode Map) for rendering maps.
- Base Map Styles: Options include Normal,
dark,light, etc. - Marker Shapes: Supports
circle,triangle,square,square column, and more. - Interactive Controls: Supports zooming, panning, and tooltips.