Appearance
Radar
Overview
A Radar Chart (also known as a Spider Chart) is used to visualize multi-dimensional data across multiple categories. Each axis represents a different category, and data points are connected to form a polygon, making it easy to compare different groups across various criteria.
When to Use
- To compare multiple categories across different dimensions (e.g., store sales by store type over multiple years).
- To identify strengths and weaknesses across various attributes.
- To analyze performance of different groups on multiple metrics.
Data Structure
A Radar Chart requires:
- Radial Axes: A categorical field representing different attributes or categories (e.g.,
store_type). - Legend (Optional): A categorical field that differentiates different groups (e.g.,
the_date(Year)). - Measures: A numerical field that defines the values plotted on the radar chart (e.g.,
store_sales). - Color(Optional): Used to set the color of the chart based on categories or numerical values (intensity-based coloring, or using a categorical field for distinct colors).
- Filters (Optional): Used to refine the displayed data (e.g., filtering by region, product category).
Example Data Structure
| store_type | the_date(Year) | store_sales |
|---|---|---|
| Supermarket | 1997 | 50000 |
| Deluxe Supermarket | 1997 | 25000 |
| Small Grocery | 1997 | 12000 |
| Mid-Size Grocery | 1997 | 10000 |
| Gourmet Supermarket | 1997 | 8000 |
| Supermarket | 1998 | 70000 |
| Deluxe Supermarket | 1998 | 40000 |
| Small Grocery | 1998 | 15000 |
| Mid-Size Grocery | 1998 | 12000 |
| Gourmet Supermarket | 1998 | 10000 |
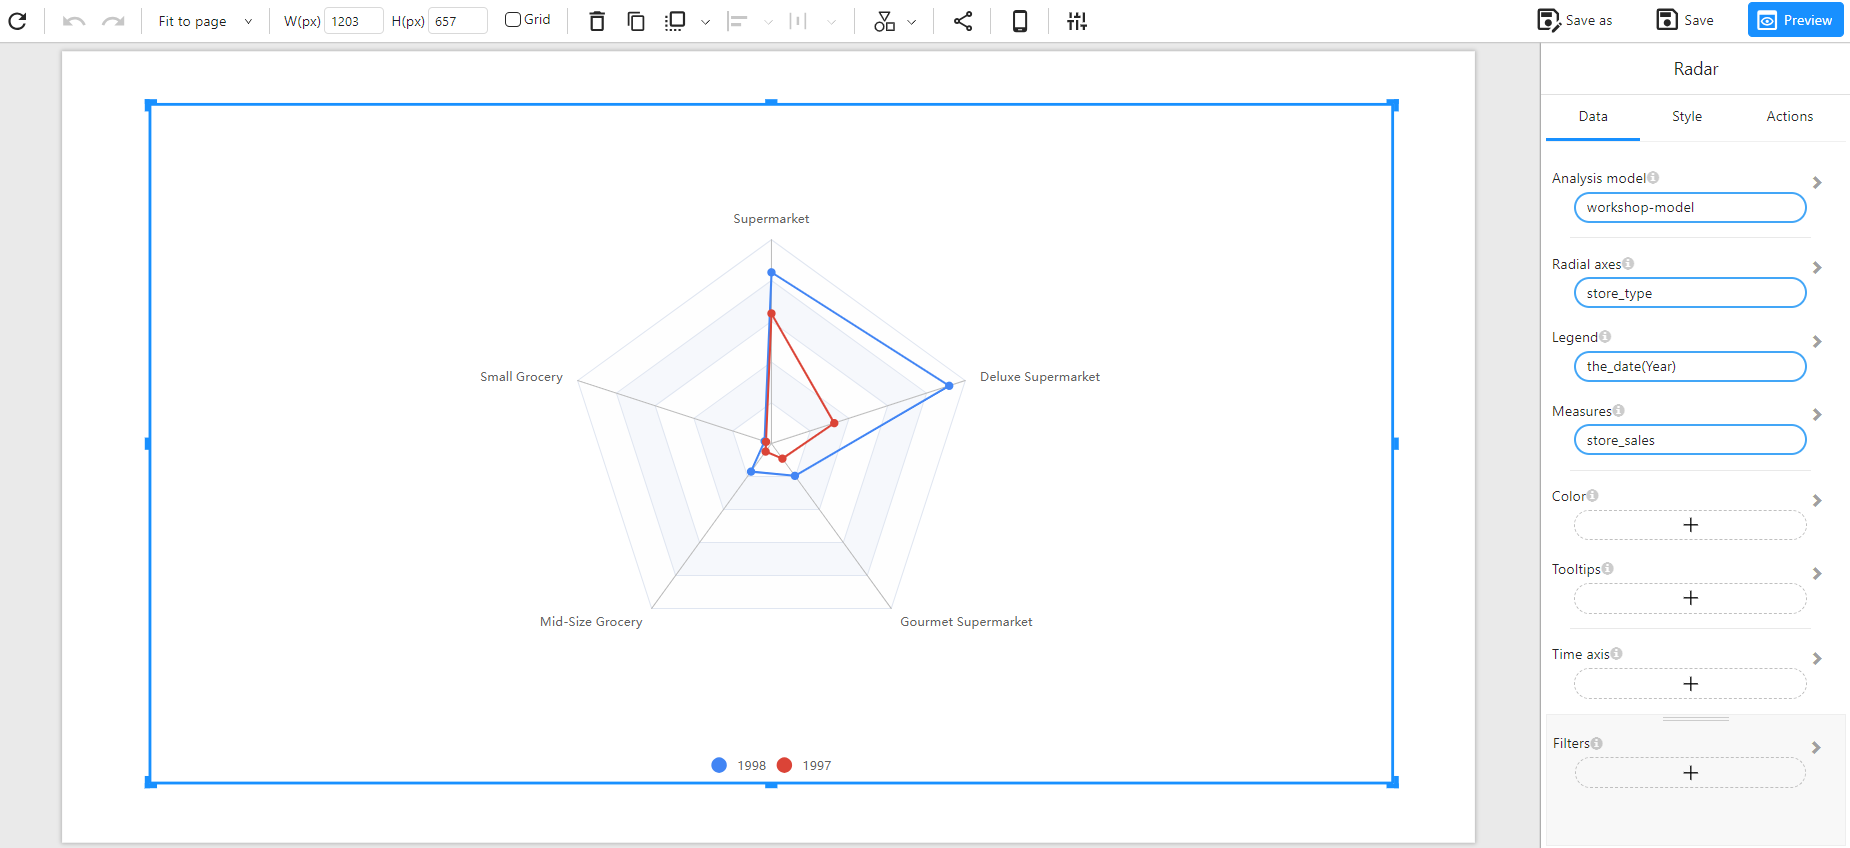
Example
The following example shows a comparison of store sales across different store types for the years 1997 and 1998.